World Wheat Atlas
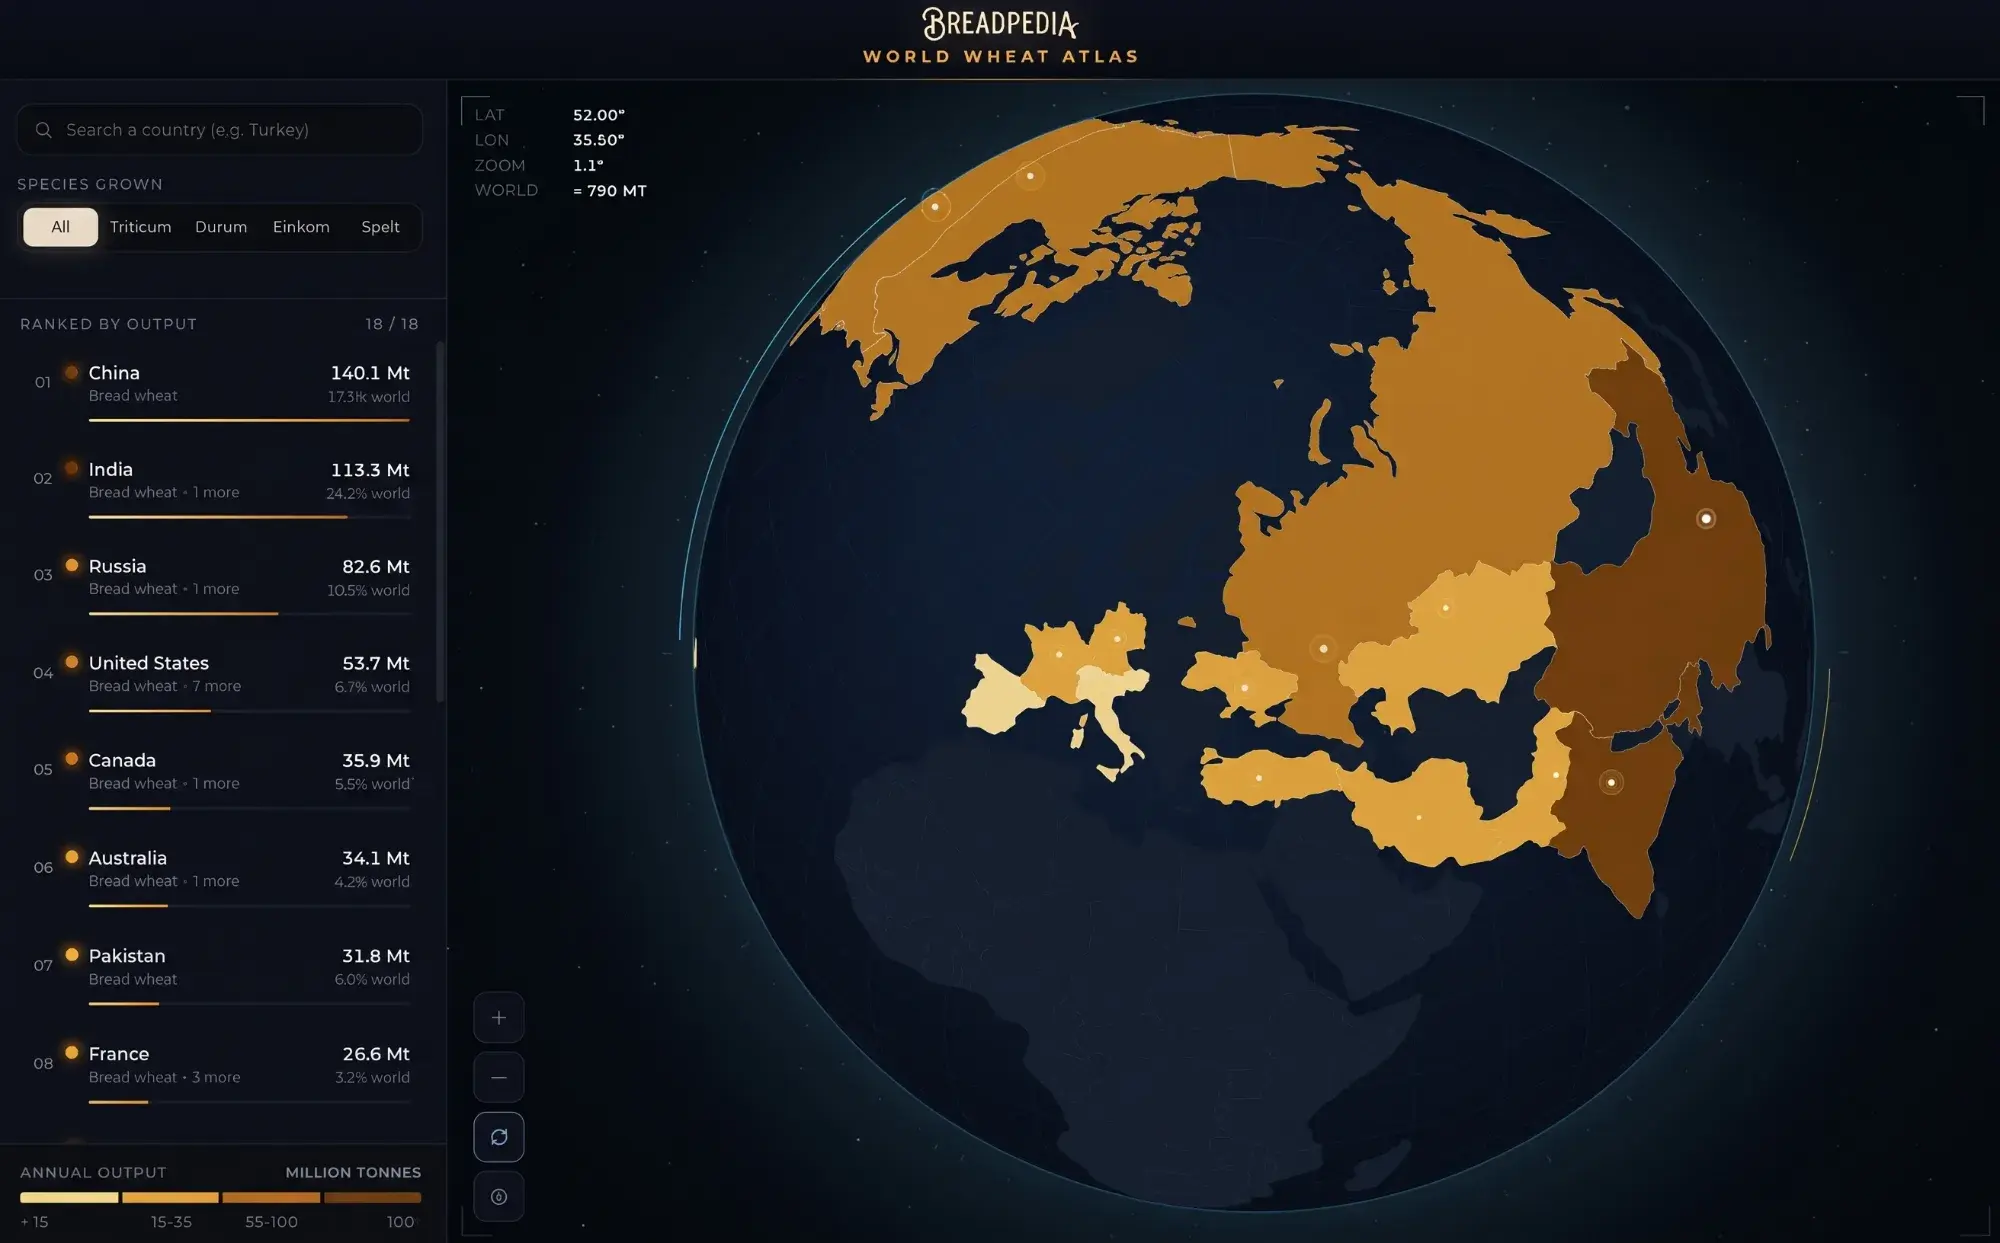
What Is the World Wheat Atlas?
The World Wheat Atlas is a dynamic 3D digital globe that tracks and visualizes global wheat production. Instead of browsing static spreadsheets or lengthy agricultural reports, users can drag, rotate, zoom, and inspect specific countries to observe annual yield metrics and grain varieties.
Key Features at a Glance
Interactive 3D Globe Navigation: Pan across continents, adjust geographical coordinates, and zoom in on specific regions.
Species Breakdown: Filter the dataset by specific Triticum species, including:
- Bread wheat (Triticum aestivum)
- Durum wheat (Triticum durum)
- Einkorn (Triticum monococcum)
- Spelt (Triticum spelta)
Output Rankings & Global Shares: Live tracking of annual production measured in millions of metric tonnes (Mt) alongside each country’s percentage share of the world’s total annual output (~799 Mt globally).
Growing Profiles: Specific metadata on dominant crop species and individual regional growing profiles per country.
Key Takeaways from the Global Leaderboard
Interacting with the Atlas reveals intriguing insights into how global wheat output is distributed:
- China & India Lead the Charge: Combining for over 31% of total world output, China (~140.1 Mt) and India (~113.3 Mt) stand as the two largest individual wheat-producing nations.
- Europe & Central Asia’s Breadbaskets: Russia (~82.6 Mt), France, Ukraine, Türkiye, and Kazakhstan represent vital hubs for bread wheat and specialized grains across Eurasia.
- The Americas & Australia: The United States (~53.7 Mt), Canada (~35.9 Mt), and Australia (~34.1 Mt) account for a massive share of high-protein bread wheat exported worldwide.
- Durum Specialties: While bread wheat dominates output in most top-producing countries, the Atlas highlights regional specialization — such as Italy, where Durum wheat leads the country’s crop profile for pasta and semolina production.
Why It Matters for Bakers and Food Enthusiasts
Grain quality, gluten development, and end-use applications vary drastically depending on where and how wheat is grown. Having quick access to geographical and species-level data bridges the gap between agricultural origin and baking science.
If you haven’t checked it out yet, head over to breadpedia.net, click on the Tools section, and spin the globe yourself.
Keep reading
All posts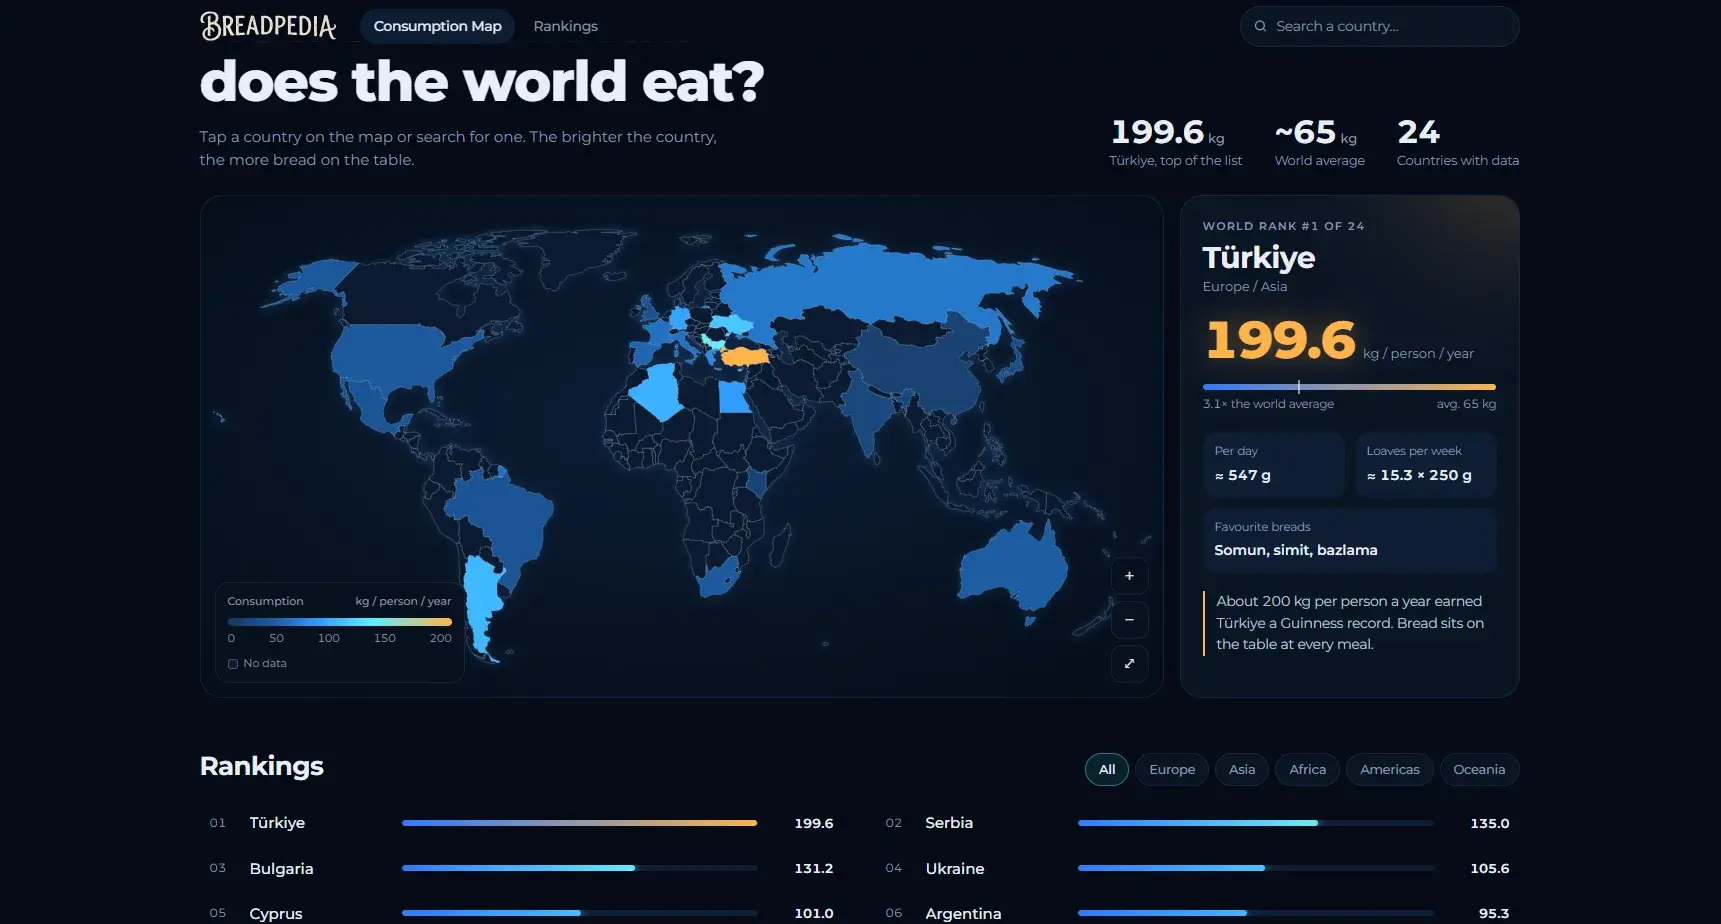
Bread Consumption Map
Few things beat the smell of fresh bread coming out of the oven. But how much of it actually makes it to the table? The answer might surprise you.
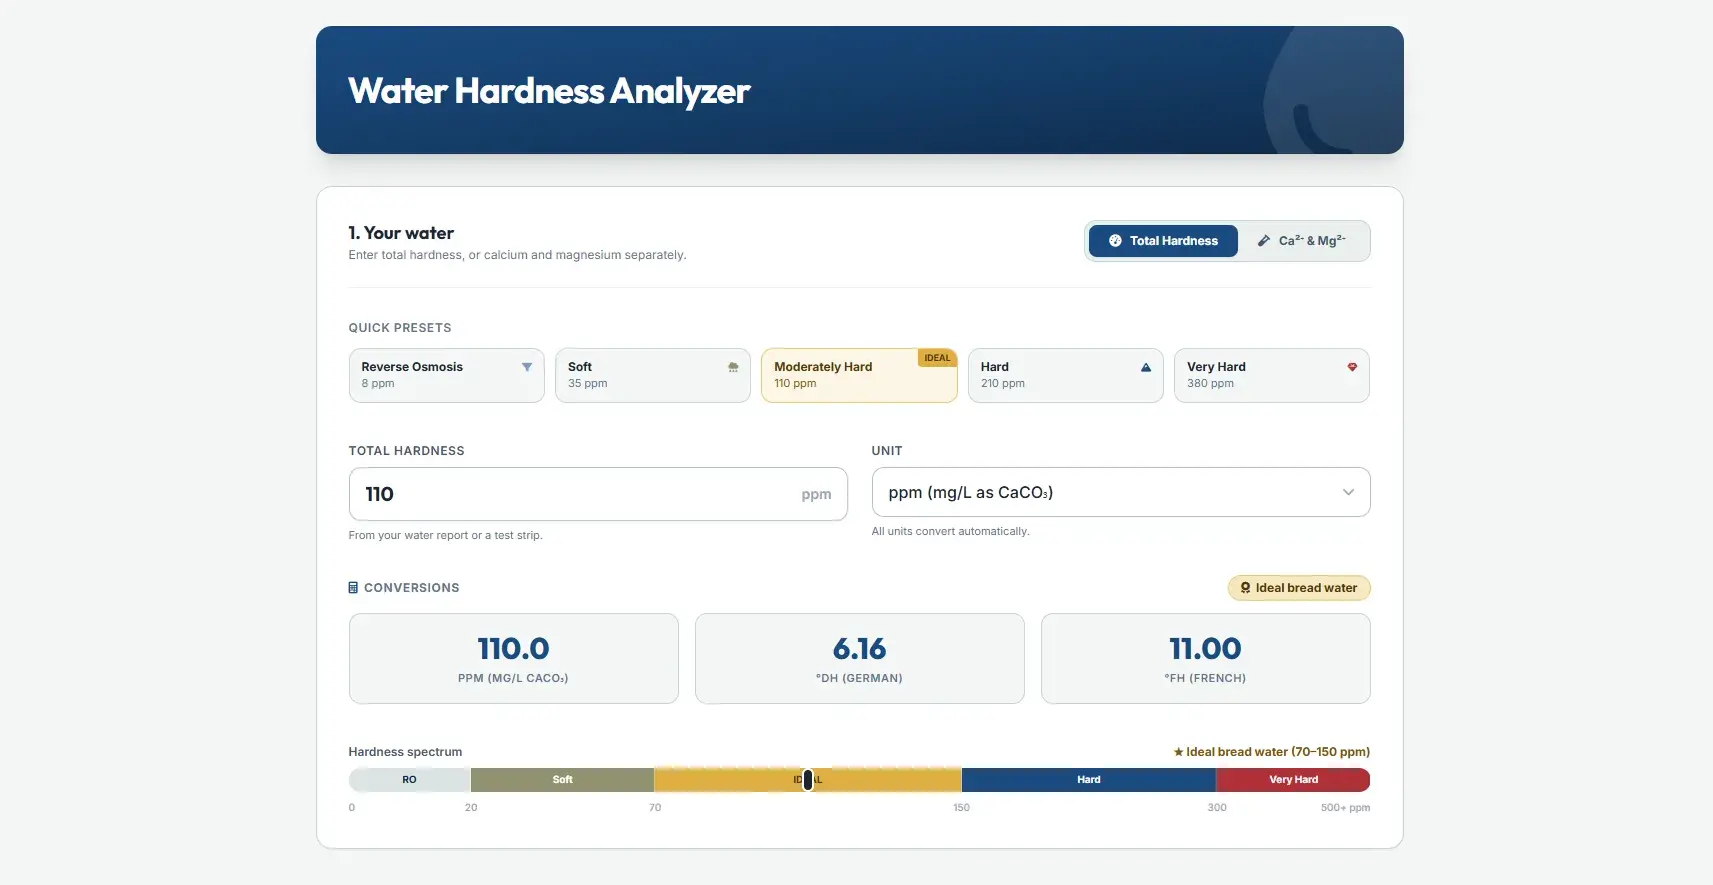
Water Hardness Analyzer
Every baker knows the basics: flour, water, yeast, salt. We fuss over protein percentages and starter hydration, but the water itself rarely gets a second…
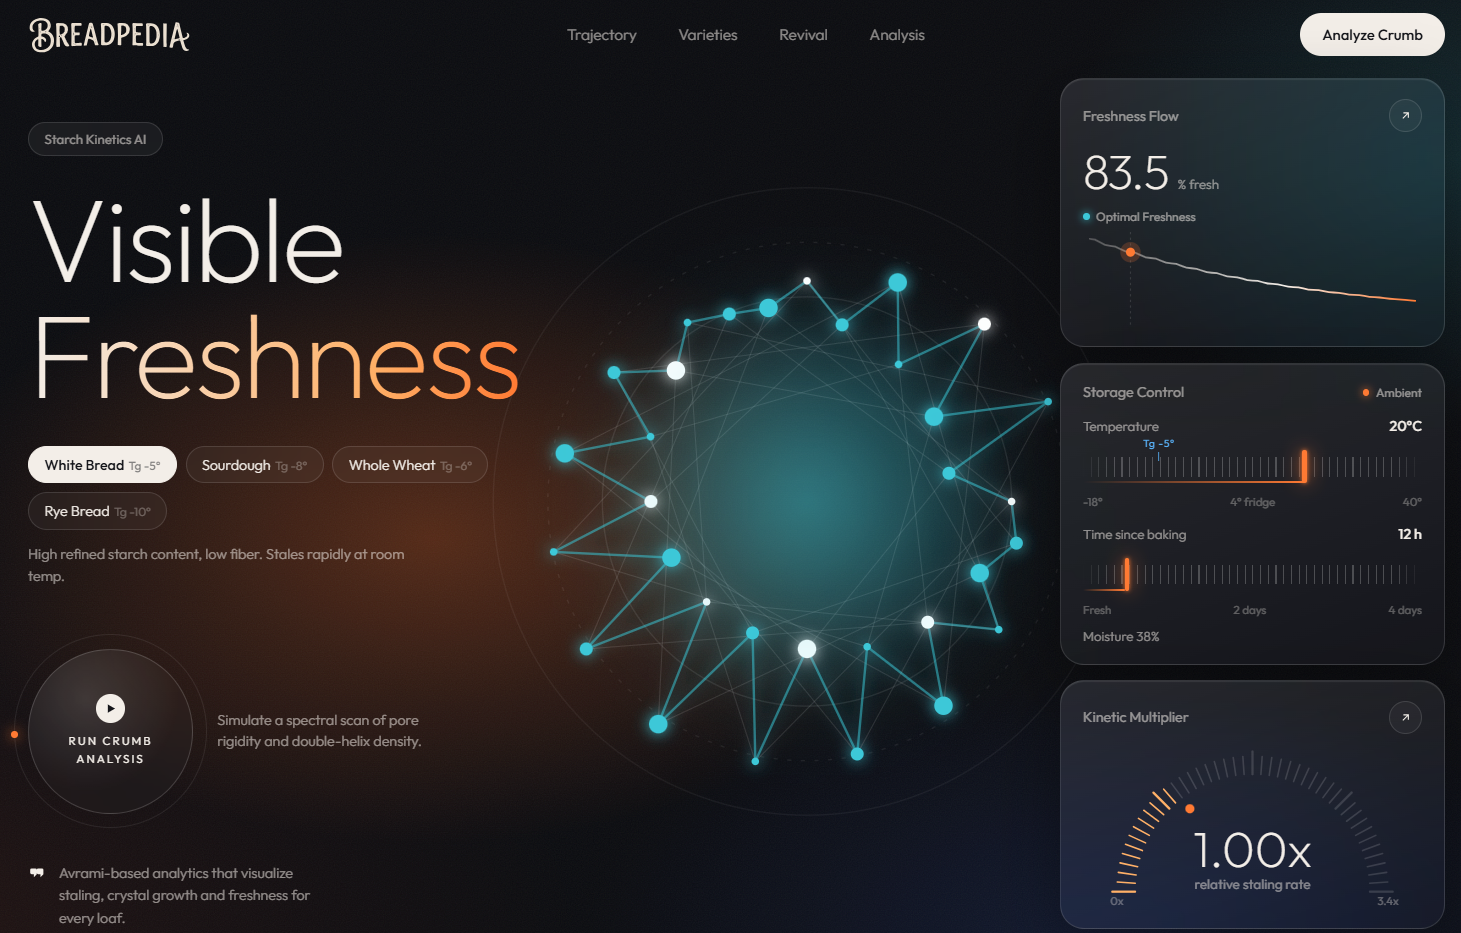
Starch Retrogradation Analyzer
Few things are as inviting as the aroma of freshly baked bread with a crispy crust and a soft interior.